A trader I know in Kampala takes mobile money all day. She also keeps a paper book, because most of what comes through the shop is still cash, and the mobile money that does arrive is usually someone sending her money rather than someone buying something.
I used to read that as a lag. Kenya got there, we are a few years behind, give it time.
I went and looked at the numbers this week, and that reading is wrong. On the measure that matters for a business, the gap between Uganda and Kenya is not closing. It is getting wider.
What the data actually says
The Global Findex is the World Bank‘s household survey on how people hold and move money, made possible by the Gates Foundation and the Mastercard Foundation. The 2025 edition carries fieldwork from 2024. Two of its columns matter here. One asks whether you have a mobile money account. The other asks whether you have ever made a digital payment to a merchant.
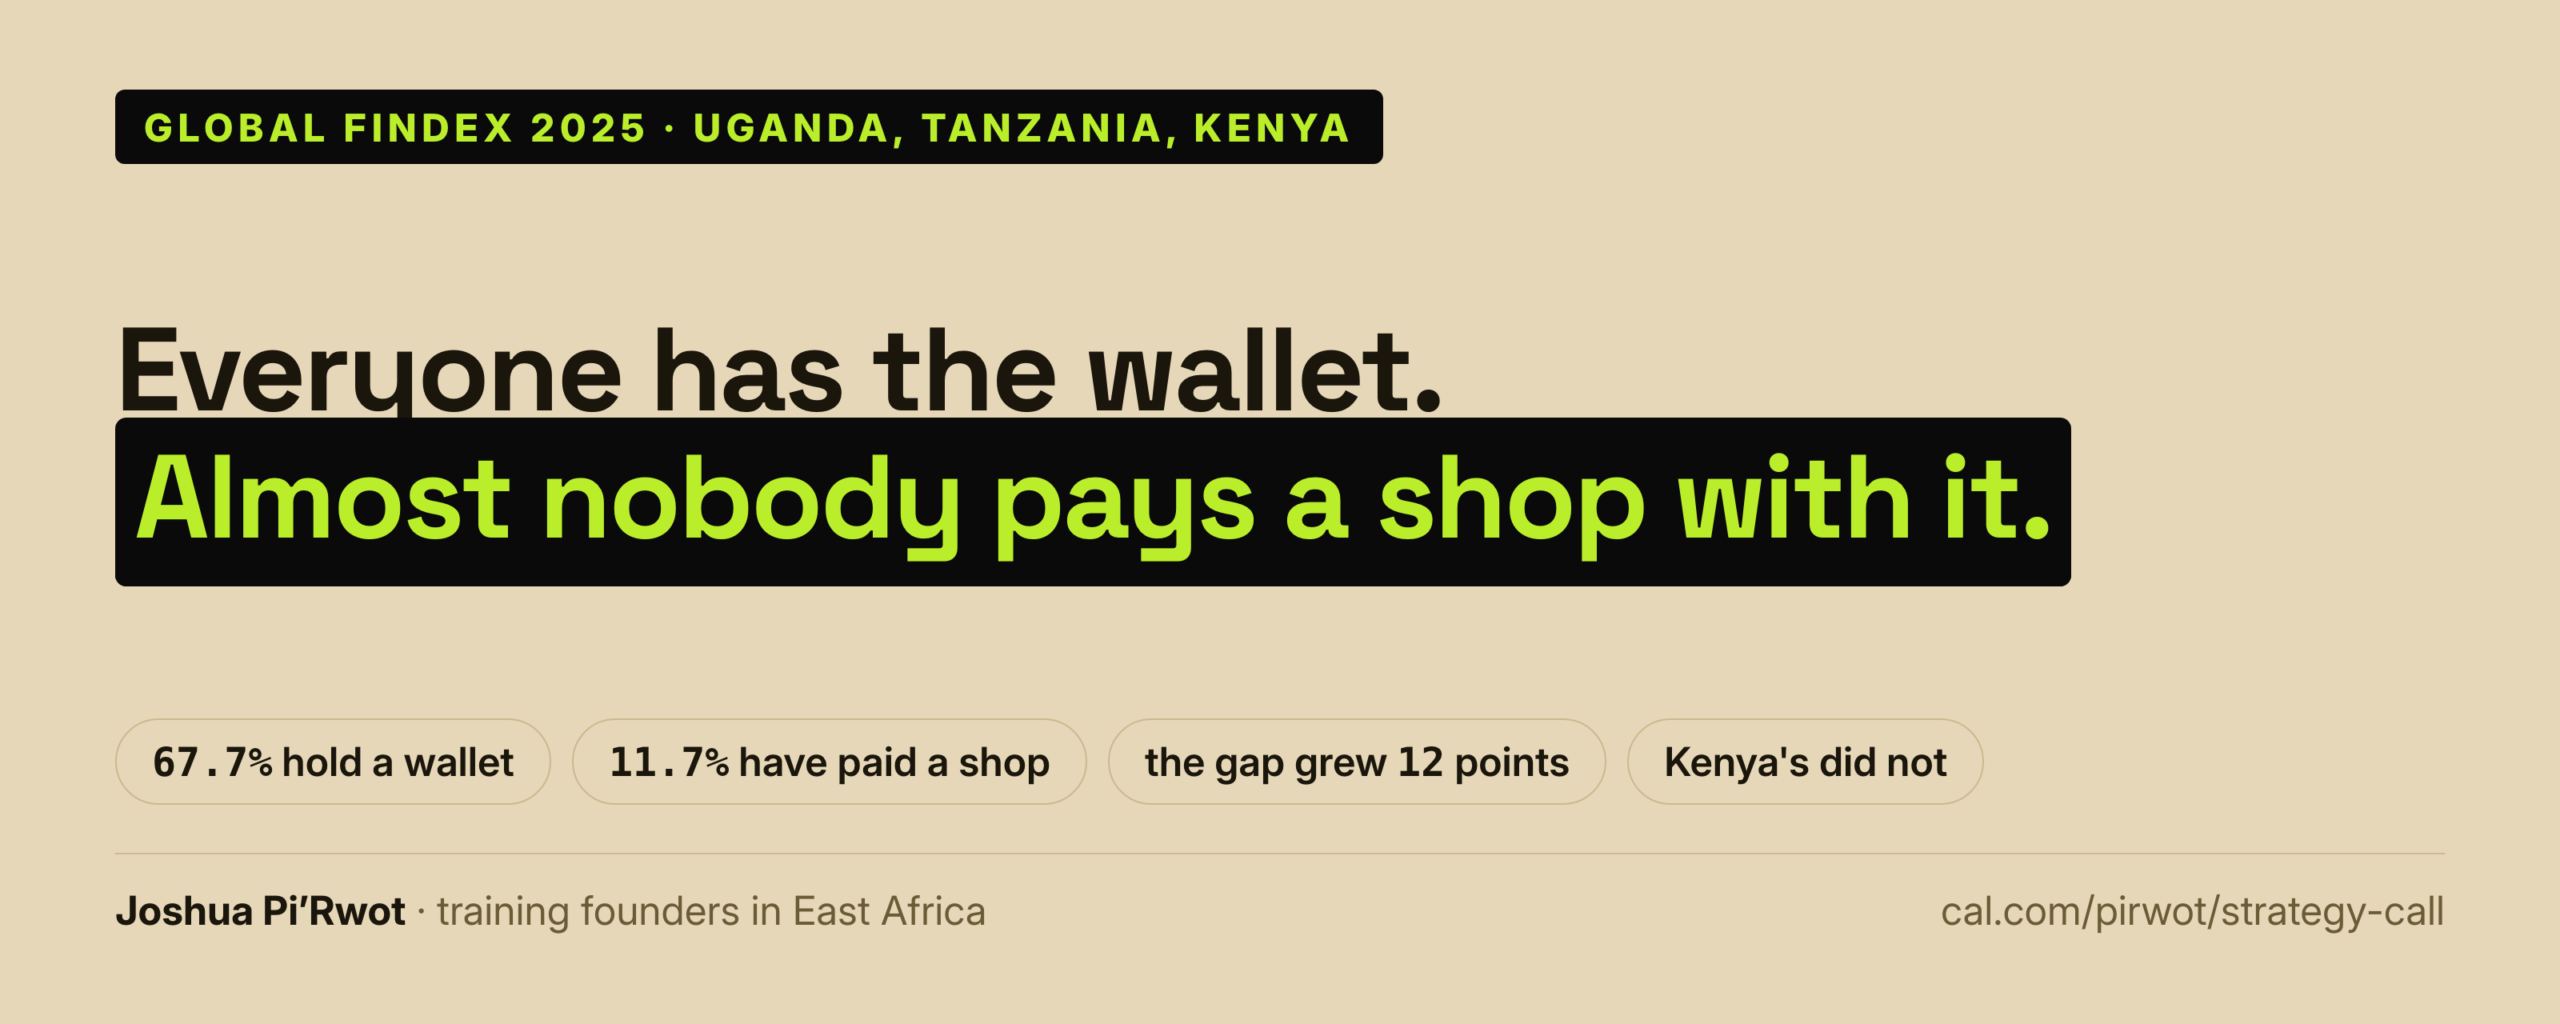
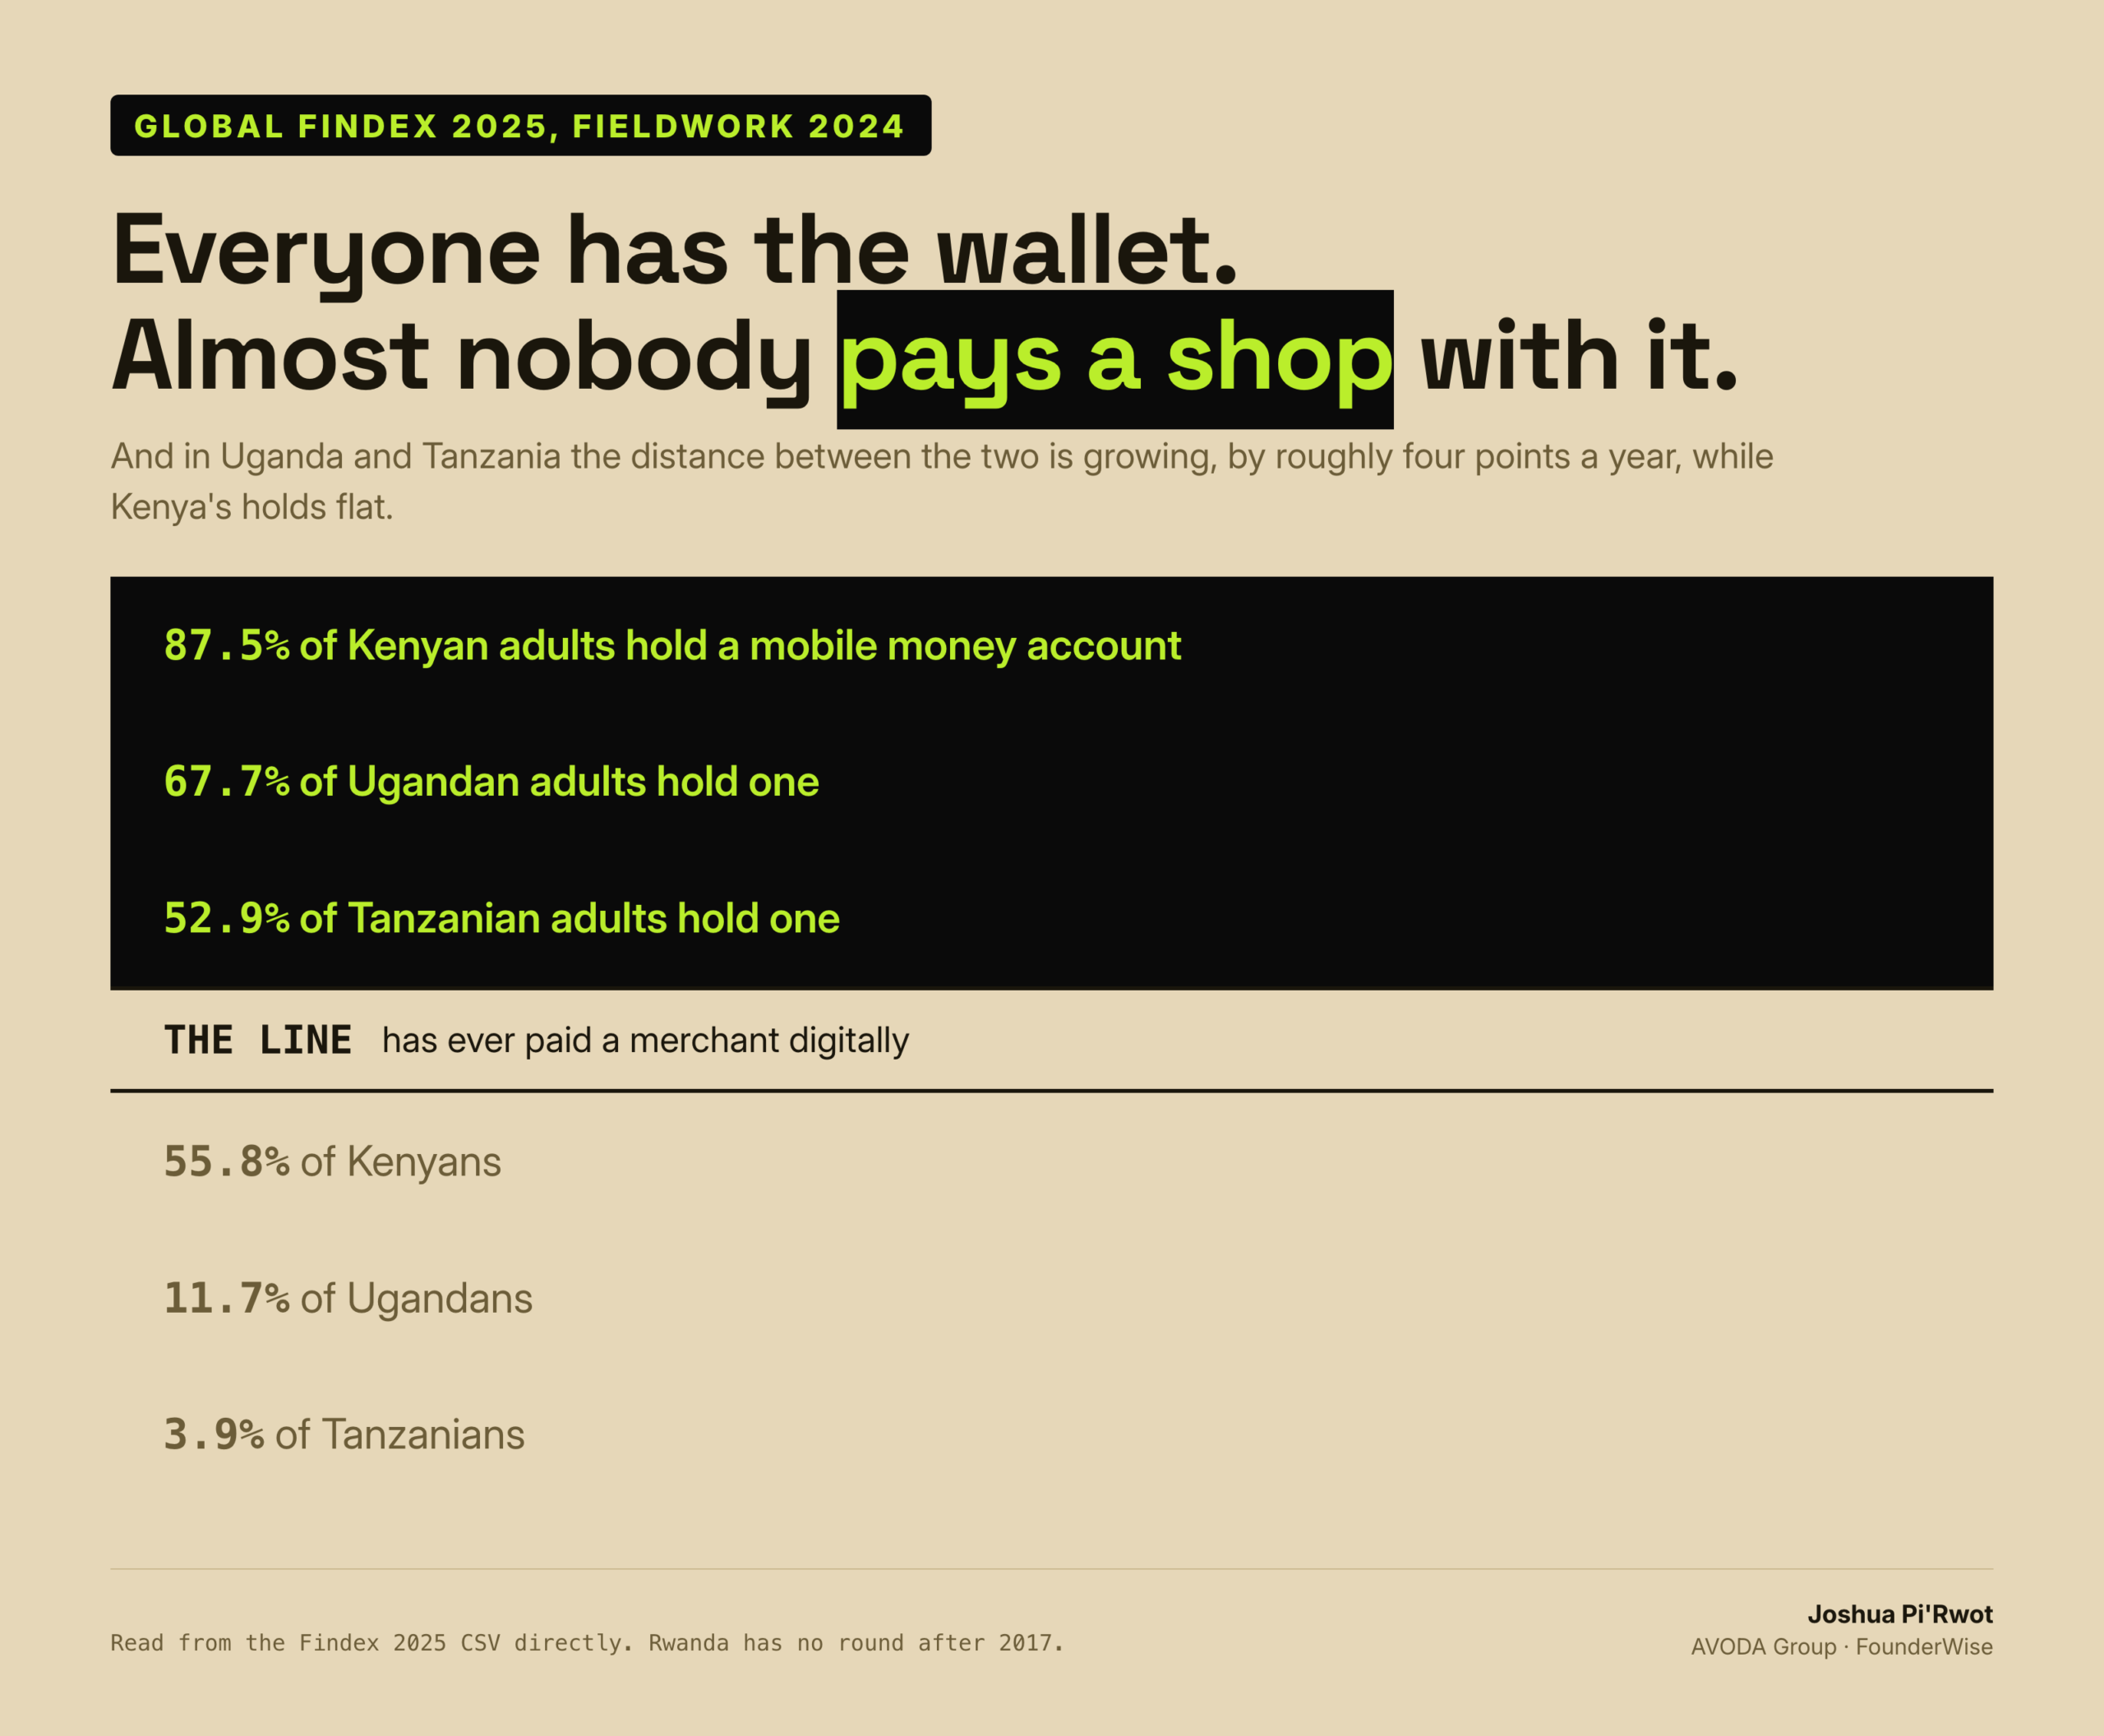
In Uganda, 67.7 percent of adults have a mobile money account. 11.7 percent have ever paid a merchant digitally.
In Tanzania, 52.9 percent have the account. 3.9 percent have paid a merchant.
In Kenya, 87.5 percent have the account and 55.8 percent have paid a merchant.
So the wallet is close to universal in Uganda and the shop payment is close to absent. Almost everyone can send money. Almost nobody buys with it.
The part that changed my mind
A single year’s gap could be a lag. So I pulled the 2021 round and put them side by side.
Between 2021 and 2024, Uganda added 13.9 points of mobile money adoption and 1.4 points of merchant payment. Tanzania added 8.3 points of mobile money and went backwards on merchant payments, from 4.5 to 3.9. Kenya added 18.8 points of mobile money and 19.0 points of merchant payment, almost exactly in step.
Put as the gap between holding a wallet and buying with it:
Uganda went from 43.5 points to 56.0. Tanzania went from 40.1 to 49.0. Kenya went from 31.9 to 31.7, which is flat.
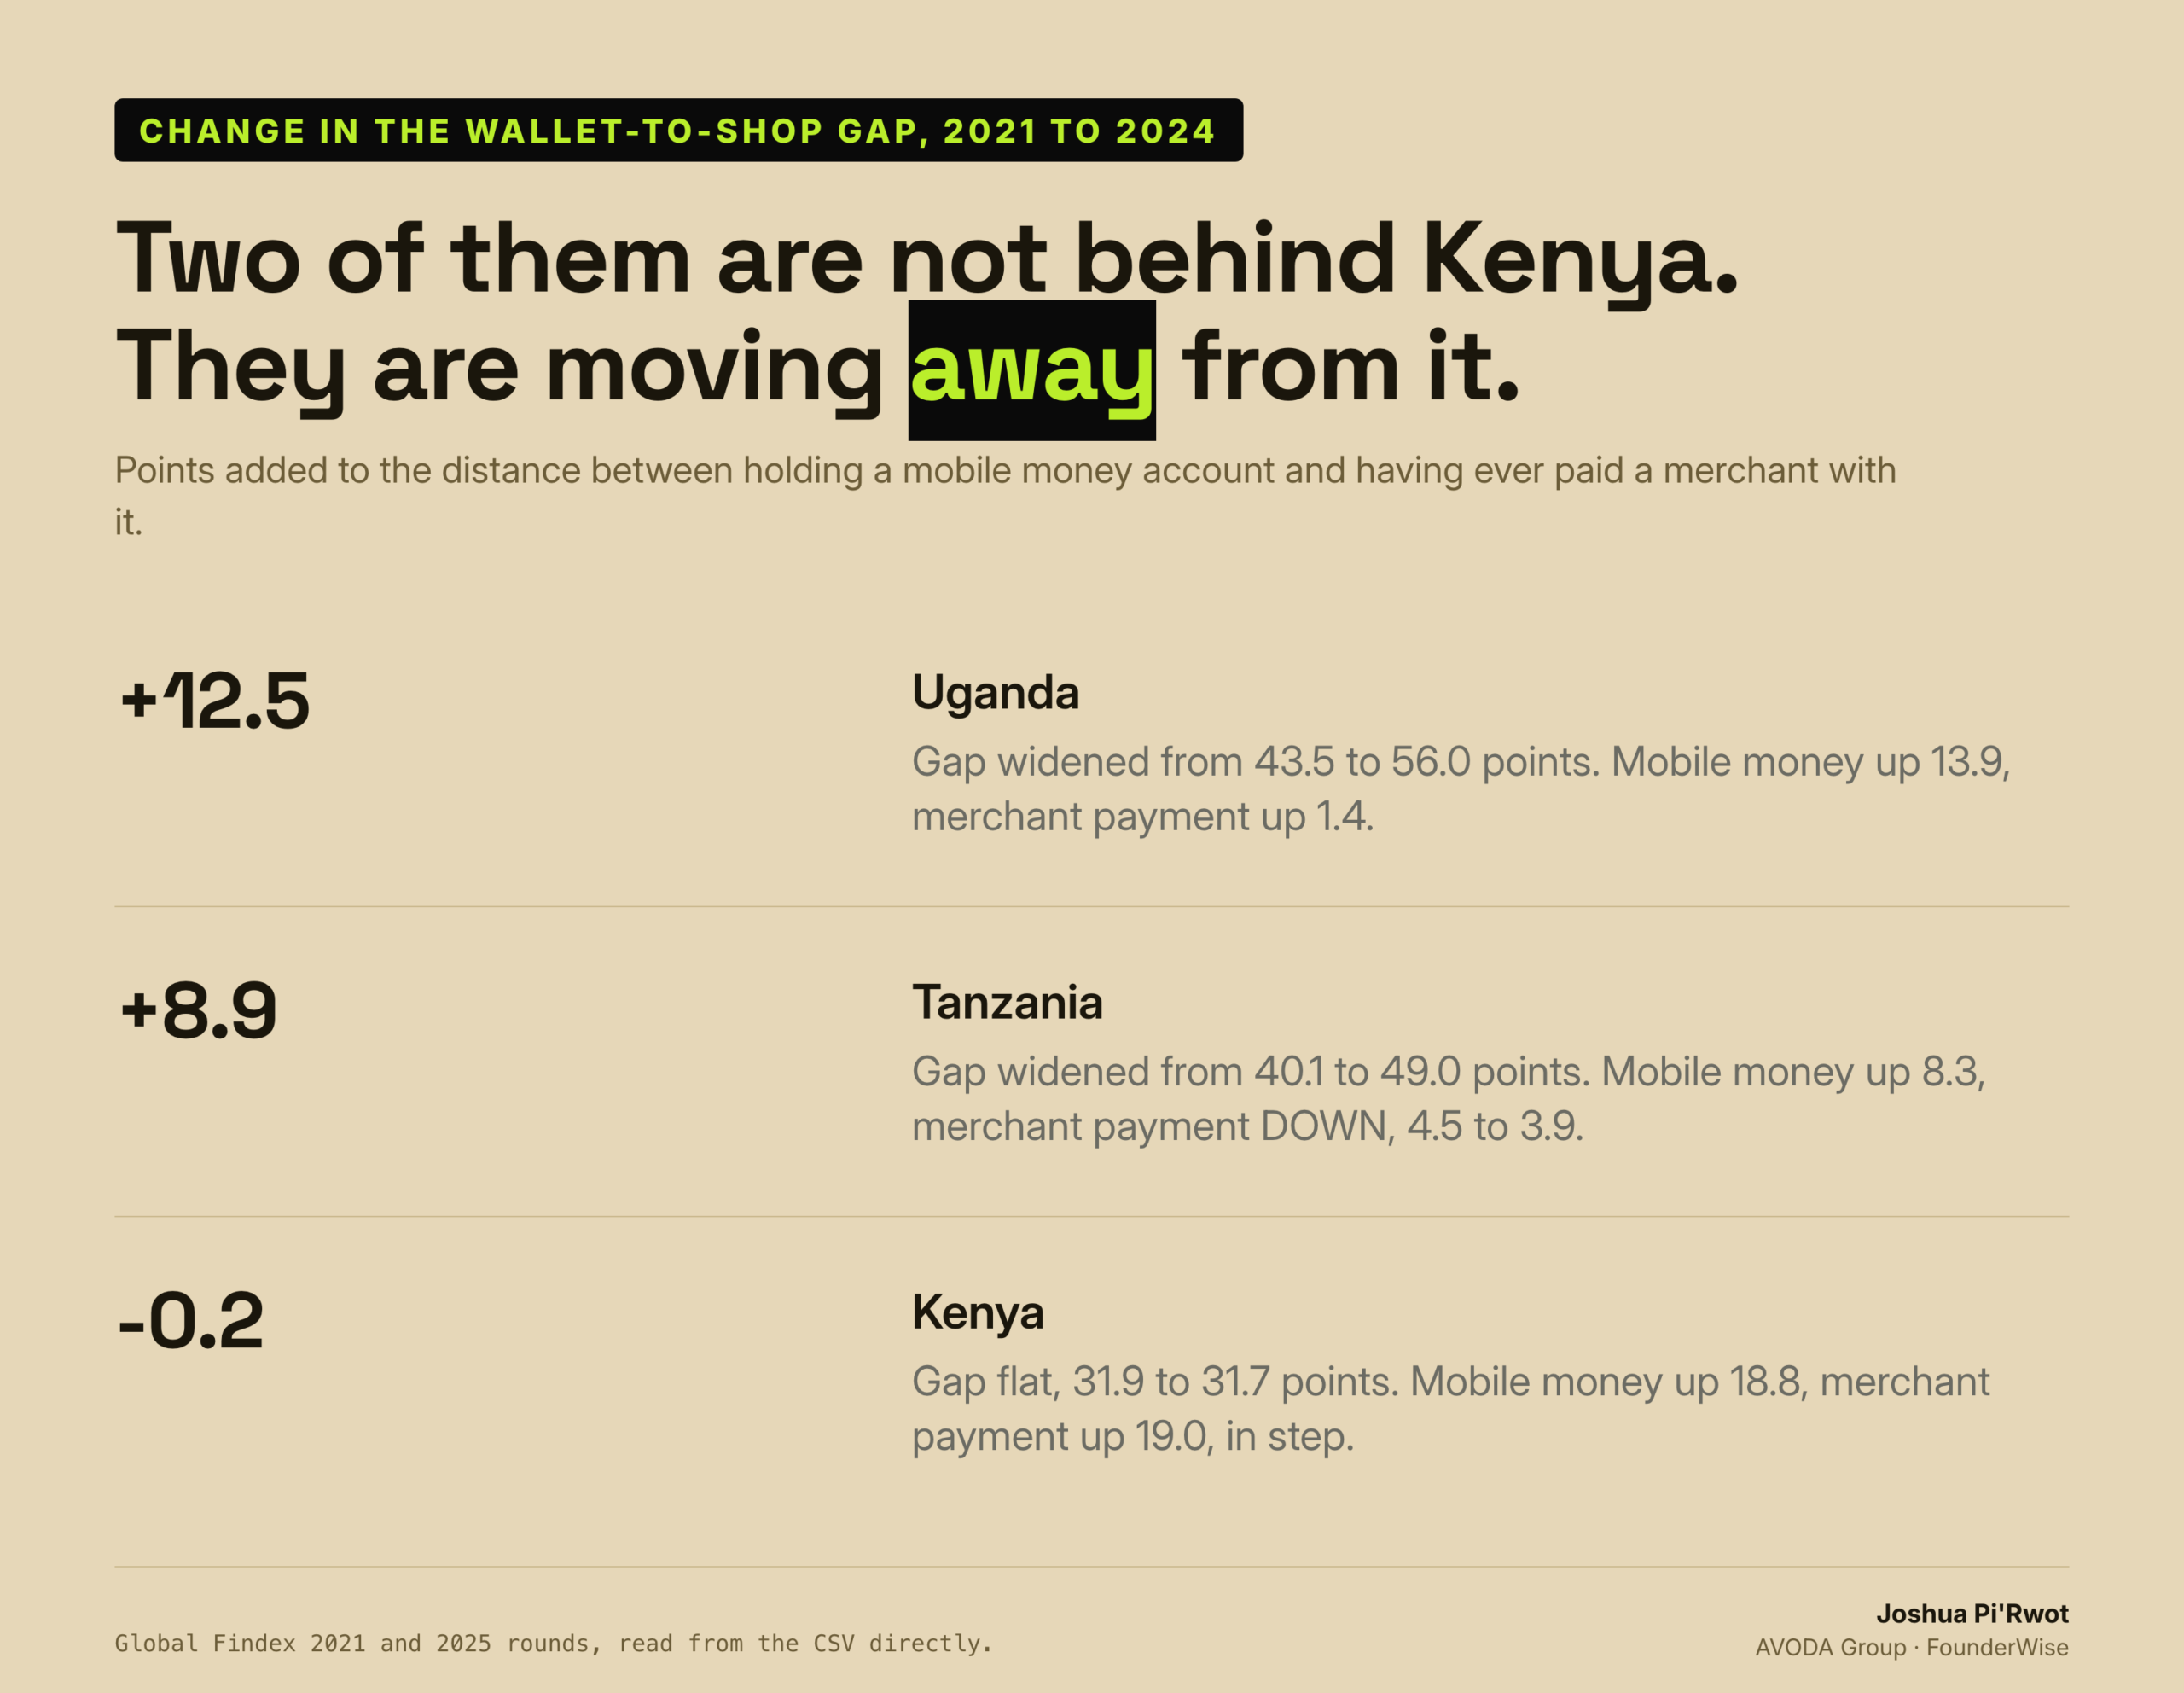
Two markets are diverging and one is holding steady. Whatever Kenya did, Uganda and Tanzania are not slowly doing the same thing. They are doing something else, and the distance is growing by roughly four points a year.
Why this is not a story about phones
The obvious explanation would be access, and access is not the constraint. Uganda’s mobile money adoption grew faster in absolute terms over that period than its merchant payments have in total, ever.
The second explanation would be banks, and that is closer. Only 26.2 percent of Ugandan adults have an account at a financial institution, against 45.4 percent in Kenya. The formal rails that merchant payments usually ride on are thinner here. But Tanzania has 21.9 percent and went backwards, while Uganda has more banking and crept forward, so bank penetration alone does not order these countries correctly either.
What separates Kenya is that paying a shop became a normal thing to do, on the same rails people already used for sending money (Safaricom‘s M-Pesa), at a price and a friction a small trader would accept. That is an acceptance problem, not a technology problem, and nothing about owning a phone solves it.
If you are building for this market
The practical version is short.
Card-first checkout is building for a rounding error. The people you are selling to overwhelmingly do not pay merchants by card, and in Uganda and Tanzania most of them have never paid a merchant digitally by any method at all.
Mobile money as a payout rail is solved. Mobile money as a checkout is not, and the numbers say your customers have no habit of using it that way. If your model assumes they do, you are assuming the single thing this data says has not happened.
Watch the merchant column, not the account column. Every deck I see quotes mobile money penetration, because it is the flattering number. It describes a wallet, not a till.
If you are the shop
There is a version of this that works in your favor. In a market where almost nobody pays merchants digitally, the ones who do are unusual customers: they are the ones with a record of what they spend, and a reason to want a receipt.
That is a small group in Uganda, about one adult in nine. It is also the group most likely to be buying for a business rather than a household, and most likely to come back. Being easy to pay digitally costs you very little and sorts your customers for you.
Before your next market assumption
Most of the market research I read about East Africa quotes the account number. It is the number that makes the region look ready, and it is real. It just does not describe whether anyone can buy anything from you.
If you are about to build, price or raise on an assumption about how people here pay, the useful exercise is to write down which number your model depends on, and then check whether the survey actually measures that. For payments, that means the merchant column. For most other assumptions it means finding the equivalent, and it is usually not the one being quoted at you.
If you are testing a product here, MVP Studio makes you name the payment method your customers will actually use before you build: app.founderwise.io/mvp
If you want to go through your own assumptions with someone who works in these markets, book a strategy call: cal.com/pirwot/strategy-call
Advice is free. Building a checkout for a habit your customers do not have is not.
So: in your current model, what share of your customers do you assume can pay you digitally, and where did that number come from?