Someone quoted a number at me in a group chat three weeks ago. The median profitable micro-SaaS earns about 4,200 dollars a month, so roughly fifty thousand a year. He was using it to argue that going solo was more viable than people think.
I went looking for where it came from. Mostly curiosity.
I found a second published median for what looks like the same population in the same year: five hundred dollars a month. And a third at around two thousand. Three medians, one sector, an eightfold spread, and no one anywhere reconciling them.
That is when the interesting question stopped being how much solo founders earn.
Every number you have read about what solo founders earn was computed over the ones who survived long enough to be counted.
Three Medians, One Population
Here are the numbers in circulation, with what each is actually measuring, as far as I could establish.
About 4,200 dollars a month
Widely quoted in 2026. Note the qualifier that travels with it and then gets dropped: median profitable micro-SaaS. Profitable. It is a median of the survivors, and the word doing the work is usually lost by the second retelling.
About 500 dollars a month
From an analysis of a thousand-plus products, published 2025. This one counts listed products rather than profitable ones, which is a wider and less flattering net.
About 24,000 dollars a year, so roughly 2,000 a month
A third figure, sitting neatly between the other two, from survey-adjacent reporting.
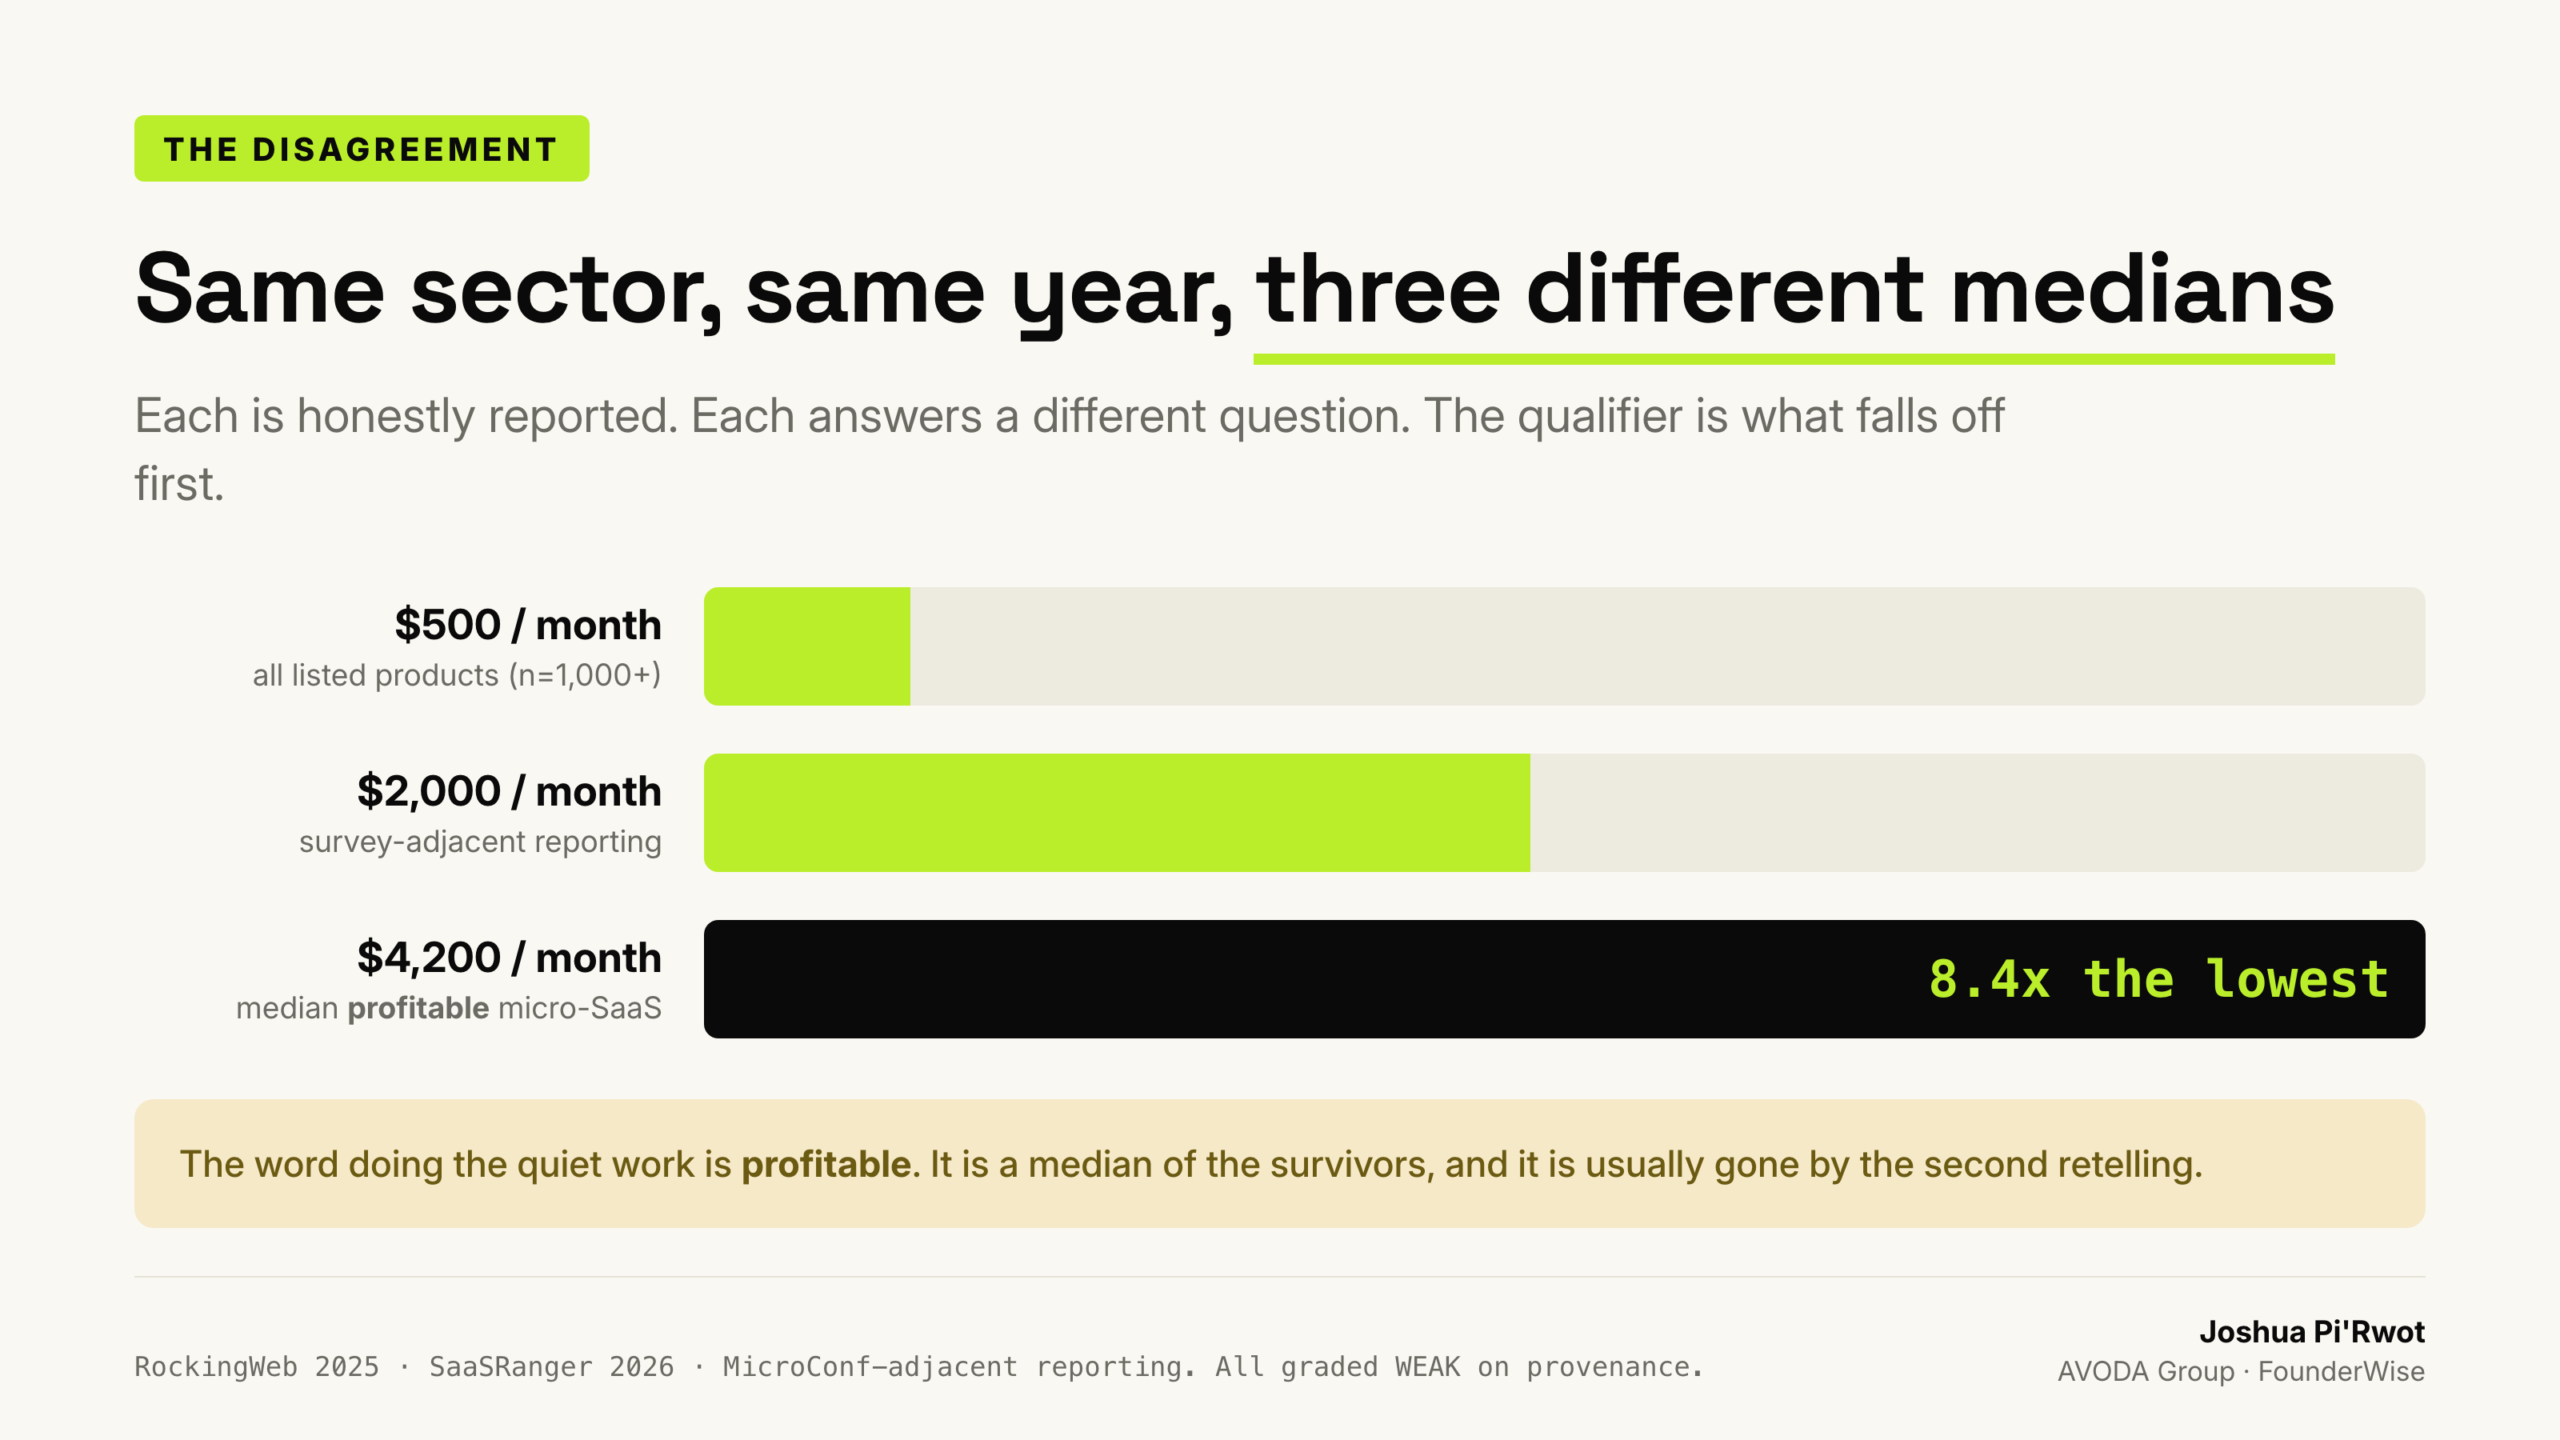
Each one is honestly reported. None of them is wrong. They are answers to three different questions that are all being asked in the same words. And the further any of them travels from its source, the more confident it gets, because the qualifiers fall off first.
A median is meaningless without its denominator, and in this sector the denominator is almost never stated.
The Denominator Is The Whole Story
Ask who got counted. Everything turns on that.
If you measure the products that are currently listed on a public directory, you have excluded everything that was taken down, which correlates almost perfectly with everything that failed. If you measure profitable products, you have excluded the unprofitable ones by definition. If you survey the members of a community built around a paid conference, you have selected for people serious and solvent enough to attend one.
Every one of those is a reasonable sampling frame for some question. Each of them sidesteps the question the reader is actually asking, which is: if I start one of these, what happens to me?
That question needs the population of everyone who started. It goes unmeasured for a structural reason rather than a lazy one. An abandoned side project just stops. Updates end, the domain lapses, the directory listing comes down, and the data point quietly ceases to have ever existed.
Why the bias runs one way
Failure removes itself from the dataset. Quietly. Success stays in it and gets louder, because a working business has a reason to keep its listing current, publish its revenue, and go on a podcast.
So the measured population drifts upward over time without a single number being falsified. The sector is showing you a filtered photograph and calling it a census. Nobody had to lie for that to happen.
Watch The Median Move
It helps to see the mechanism rather than just be told about it, so here is the arithmetic in miniature.
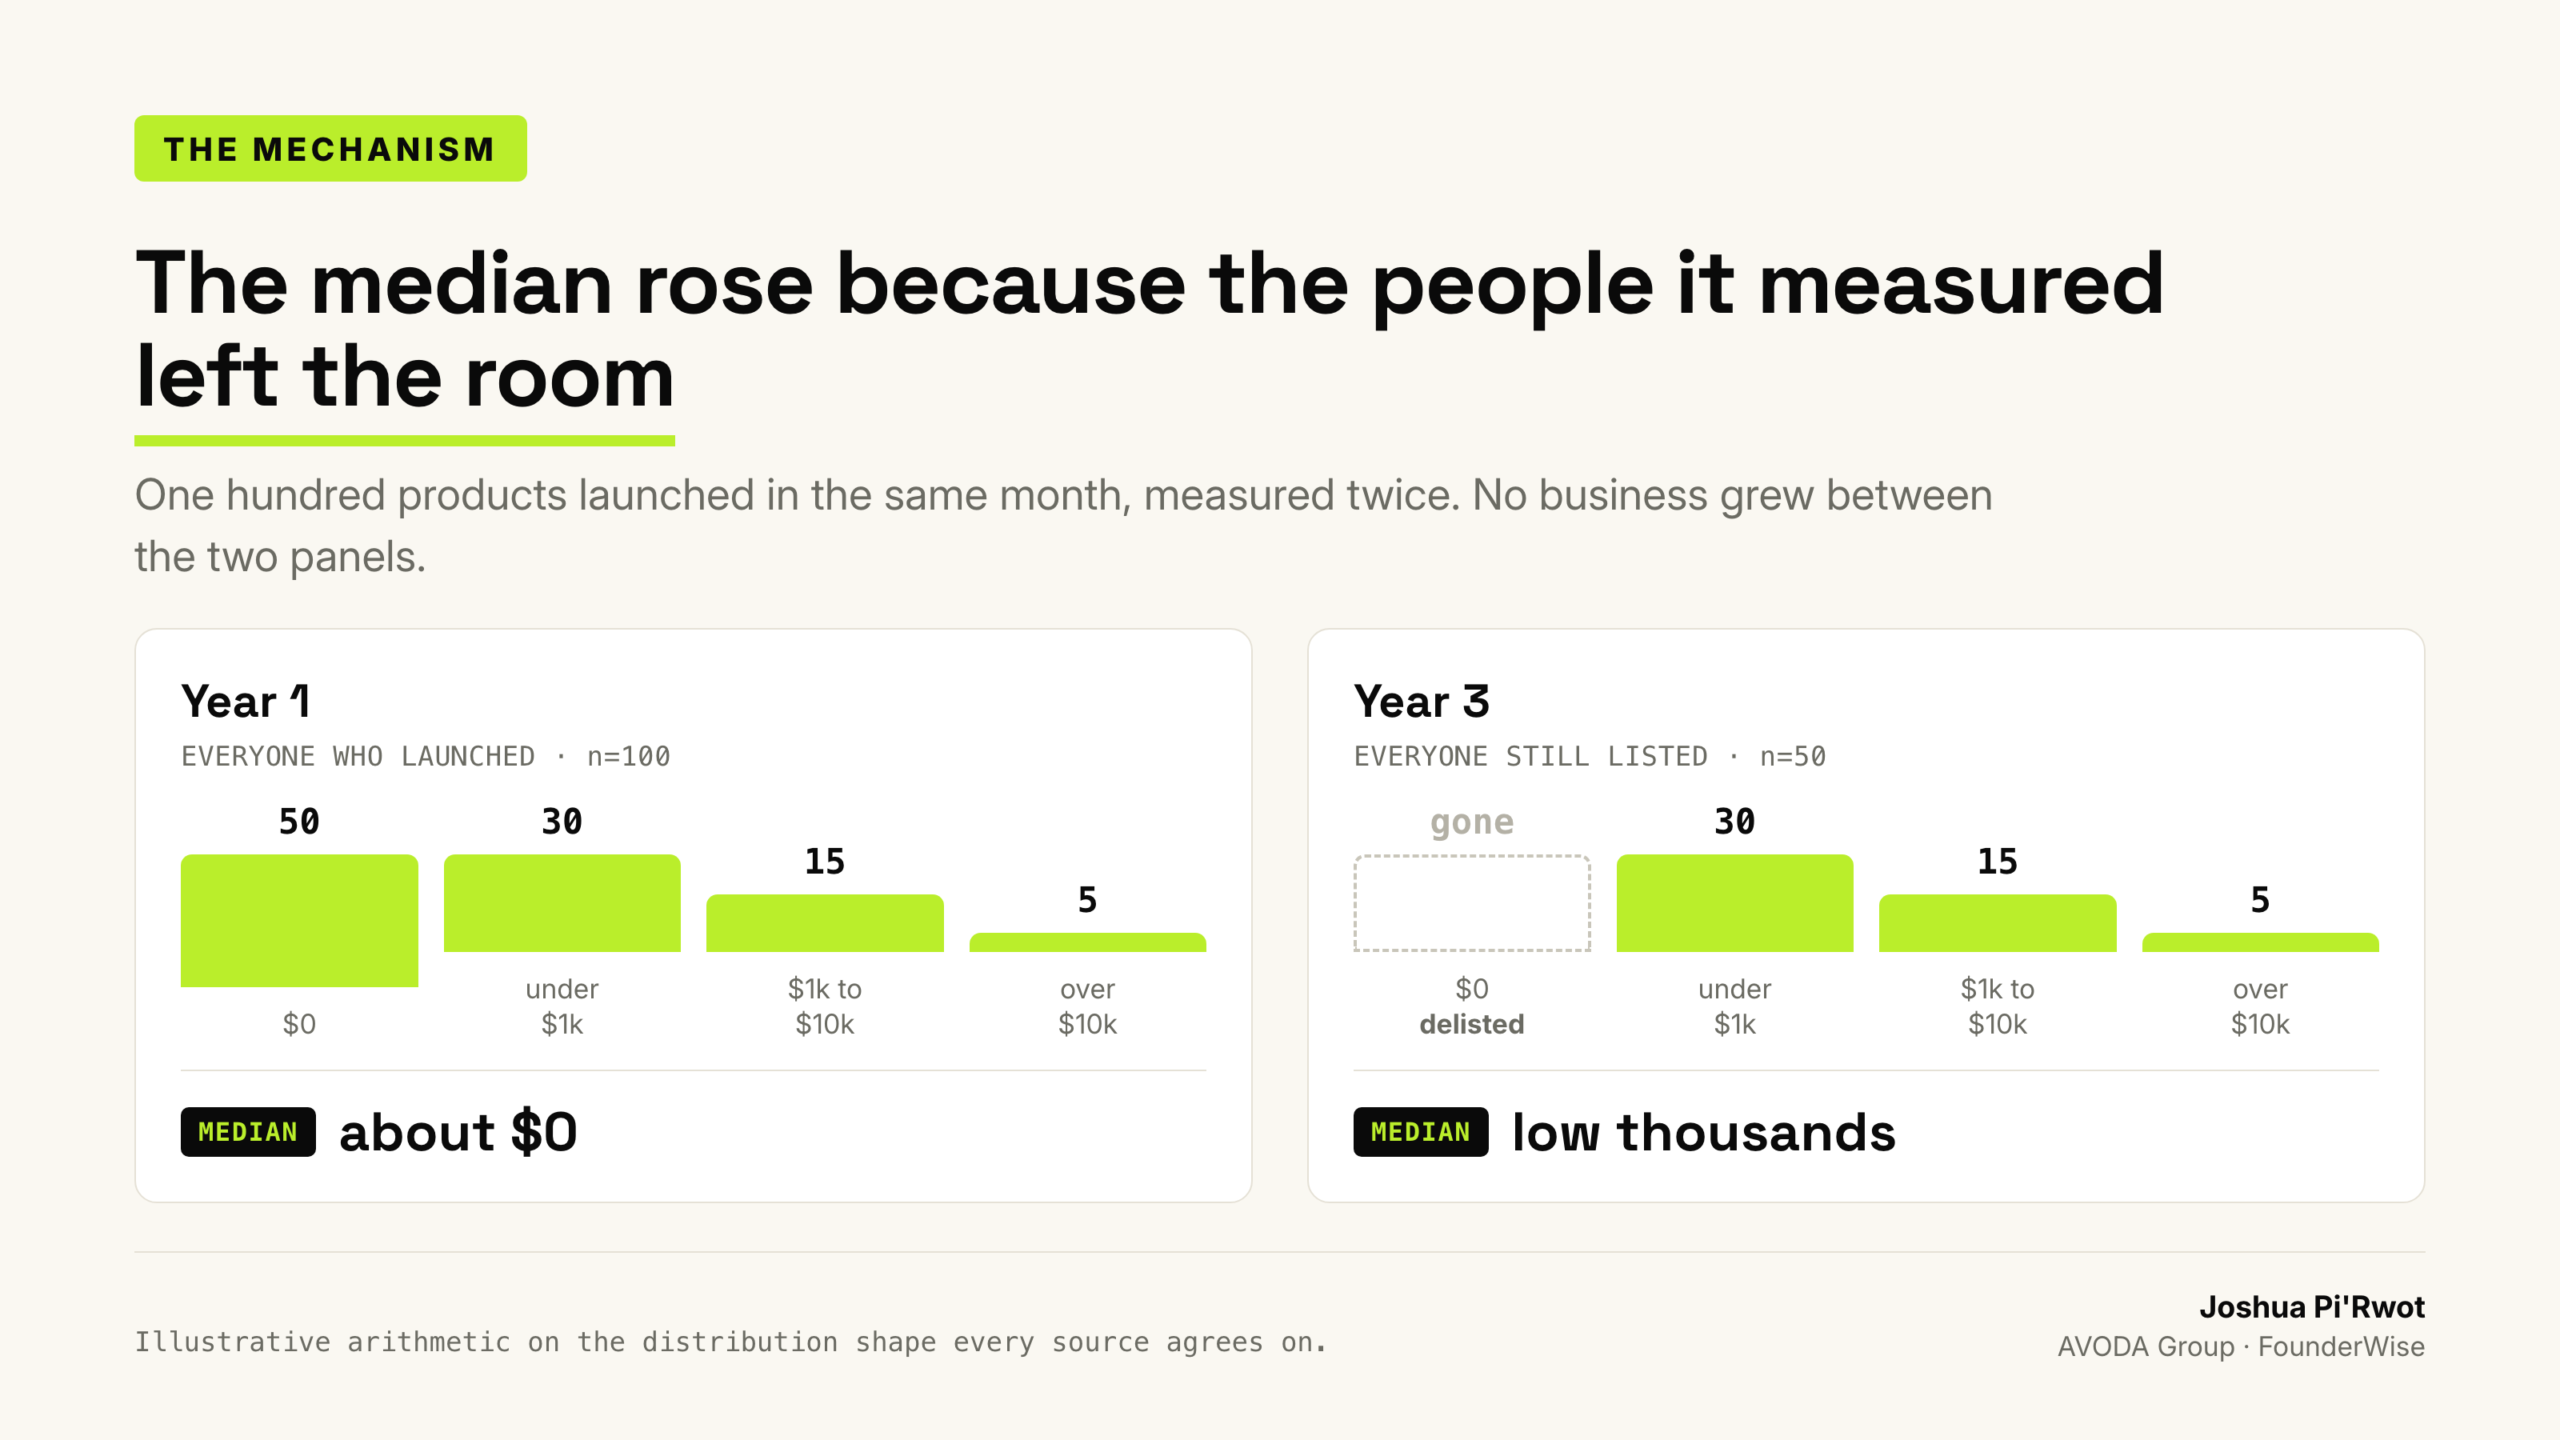
Imagine a hundred people launch a product in the same month. A year later the picture is what every source agrees on. Fifty sit at zero or near it. Thirty are under a thousand a month. Fifteen land between one and ten thousand. Five clear that.
The median of all hundred is somewhere near zero. That is the number a founder deciding whether to start should want.
Now wait two more years and measure again. The fifty at zero have mostly stopped. Their domains lapse and their listings come down. They leave the dataset rather than registering as failures, because the dataset is built by looking at what exists.
Measure the survivors and the median is now somewhere in the low thousands. Every business in the picture stayed exactly where it was. The bottom of the distribution walked out of the room and took the median with it.
The median rose because the people it was measuring left. That is the entire trick, and it happens without anyone intending it.
Then add the second filter, the word profitable, and the remaining population is smaller and higher again. Two filters, both defensible, and the published figure is now several times the one a prospective founder actually needs.
Who Benefits From The Optimistic Number
It is worth asking who is producing these figures, because in this sector almost nobody is doing it for free.
Look at who publishes them. People selling micro-SaaS courses. Boilerplate starter kits. Directories that charge for listings, communities that charge for membership, and tool vendors whose customers are aspiring solo founders. An encouraging median is commercially useful to all of them. A pessimistic one costs them customers.
Be careful with that, because it is a claim about incentives rather than about anyone’s honesty, and the two get confused. Fabrication has little to do with it. When three figures are available and one of them is cheerful, the cheerful one travels. Hundreds of people pick it independently. Every one of them is acting in good faith.
That is how a sector ends up with a consensus number that arrived by drift, with no author and no source.
The tell to watch for
When you see one of these figures, look for whether the qualifier survived. “Median profitable micro-SaaS” is a defensible statement. “Median micro-SaaS” is a different and much lower number. If the piece you are reading has dropped the word, the author either did not notice or did not want you to.
The One Real Survey Says Something Inconvenient
There is a genuine benchmark in this space, and it is worth treating differently from the blog numbers.
MicroConf’s State of Independent SaaS ran its fourth annual edition in 2024, covering founders across 41 countries and 265 cities. It has a defined population and repeat waves, which is two more methodological virtues than anything else I found.
I will be honest about one thing here, because it is the same disease. I wanted to give you the sample size and I cannot. One secondary source says 836 founders, another says nearly 700, and the report itself sits behind a download form I would have to fill in to check. So I am quoting the country count, which comes from MicroConf directly, and leaving the n out rather than picking the number I liked.
Two things about it.
First, it is two years old. The most recent edition I could locate is from 2024. In a sector where people confidently quote 2026 medians, the best real survey predates the AI tooling wave that changed what one person can build. That gap is a reason for more caution.
Second, and more interesting: it found that three-founder teams grew two to three times faster than solo founders.
The only rigorous survey in the genre points against the thing the genre exists to celebrate.
That finding rarely gets quoted. The reason is mundane: a survey result saying “you would probably do better with co-founders” fits badly into content aimed at people who have already decided to go it alone.
Three Claims That Fall Apart On Sight
Some of these claims fail on their face. Look at the shape rather than the number.
“28 percent of founders quit between 1,000 and 5,000 dollars a month”
Over what period? A churn figure without an observation window is not a statistic. It is a number. Twenty-eight percent over one year and twenty-eight percent over ten years describe completely different worlds, and the claim as published stays silent on which.
“54 percent of products make nothing”
Published alongside a distribution from the same source that puts about fifty percent in the bottom band. Those two figures contradict each other, and the contradiction went unremarked, which tells you how carefully these get assembled.
“21 percent of committed, AI-leveraged founders hit 500,000 dollars, against a national average of 1.4 percent”
This is the most instructive one, because the error is visible in the sentence. The sample is defined partly by the outcome: committed founders who used AI well. Then the comparison to a general average is presented as though commitment caused the difference. The source itself concedes survivorship bias and publishes the comparison anyway.
The Shape Is The Part Worth Trusting
Here is what I think survives.
The shape is consistent across every source, and the shape is a long tail with almost everything piled at the bottom. Roughly half of products earn approximately nothing. Something like one in ten reaches a level that would replace a professional salary. A very small percentage, low single digits, reaches the numbers that get written about.
That shape is believable. It matches every other creative-and-distribution market anyone has measured properly. Apps, books, music, newsletters, restaurants. The mechanism is the same in all of them, which is why I trust the shape while holding every specific median loosely.
Where you personally sit in that distribution is beyond what this data can say, and beyond what anyone quoting it can say either, which is the actual practical point of this article.
Four Numbers You Can Actually Know
Since the sector’s benchmarks are useless for judging your own position, build internal ones. Four that are cheap and mean something.
1. Months of runway, stated as a date
The actual calendar date on which you must have income or stop. Written down, in figures, where you can see it. People avoid this number. It is the one that decides which choices you still have.
2. Paying customers, counted by hand
Paying customers only. Signups, trials and your own test accounts stay out of the count. Use the number you could read out from memory. Below about twenty, dashboards are actively misleading because the percentages swing wildly on single events.
3. Whether last month’s customers are still here
Retention on a small base is the most informative number a small business has and the one most often skipped in favour of growth. Five hundred users who stay beats five thousand who pass through, and it is a far better predictor of whether the thing works.
4. Your own hourly rate, calculated honestly
Total money earned, divided by total hours worked on it, since the beginning. Include the nights. All of them. It is a brutal number early on. It should be. This is the comparison that makes “I should get a job” true or false, and most people settle that question on feeling.
Four numbers you can check on a Sunday afternoon will tell you more about your business than every benchmark published this year.
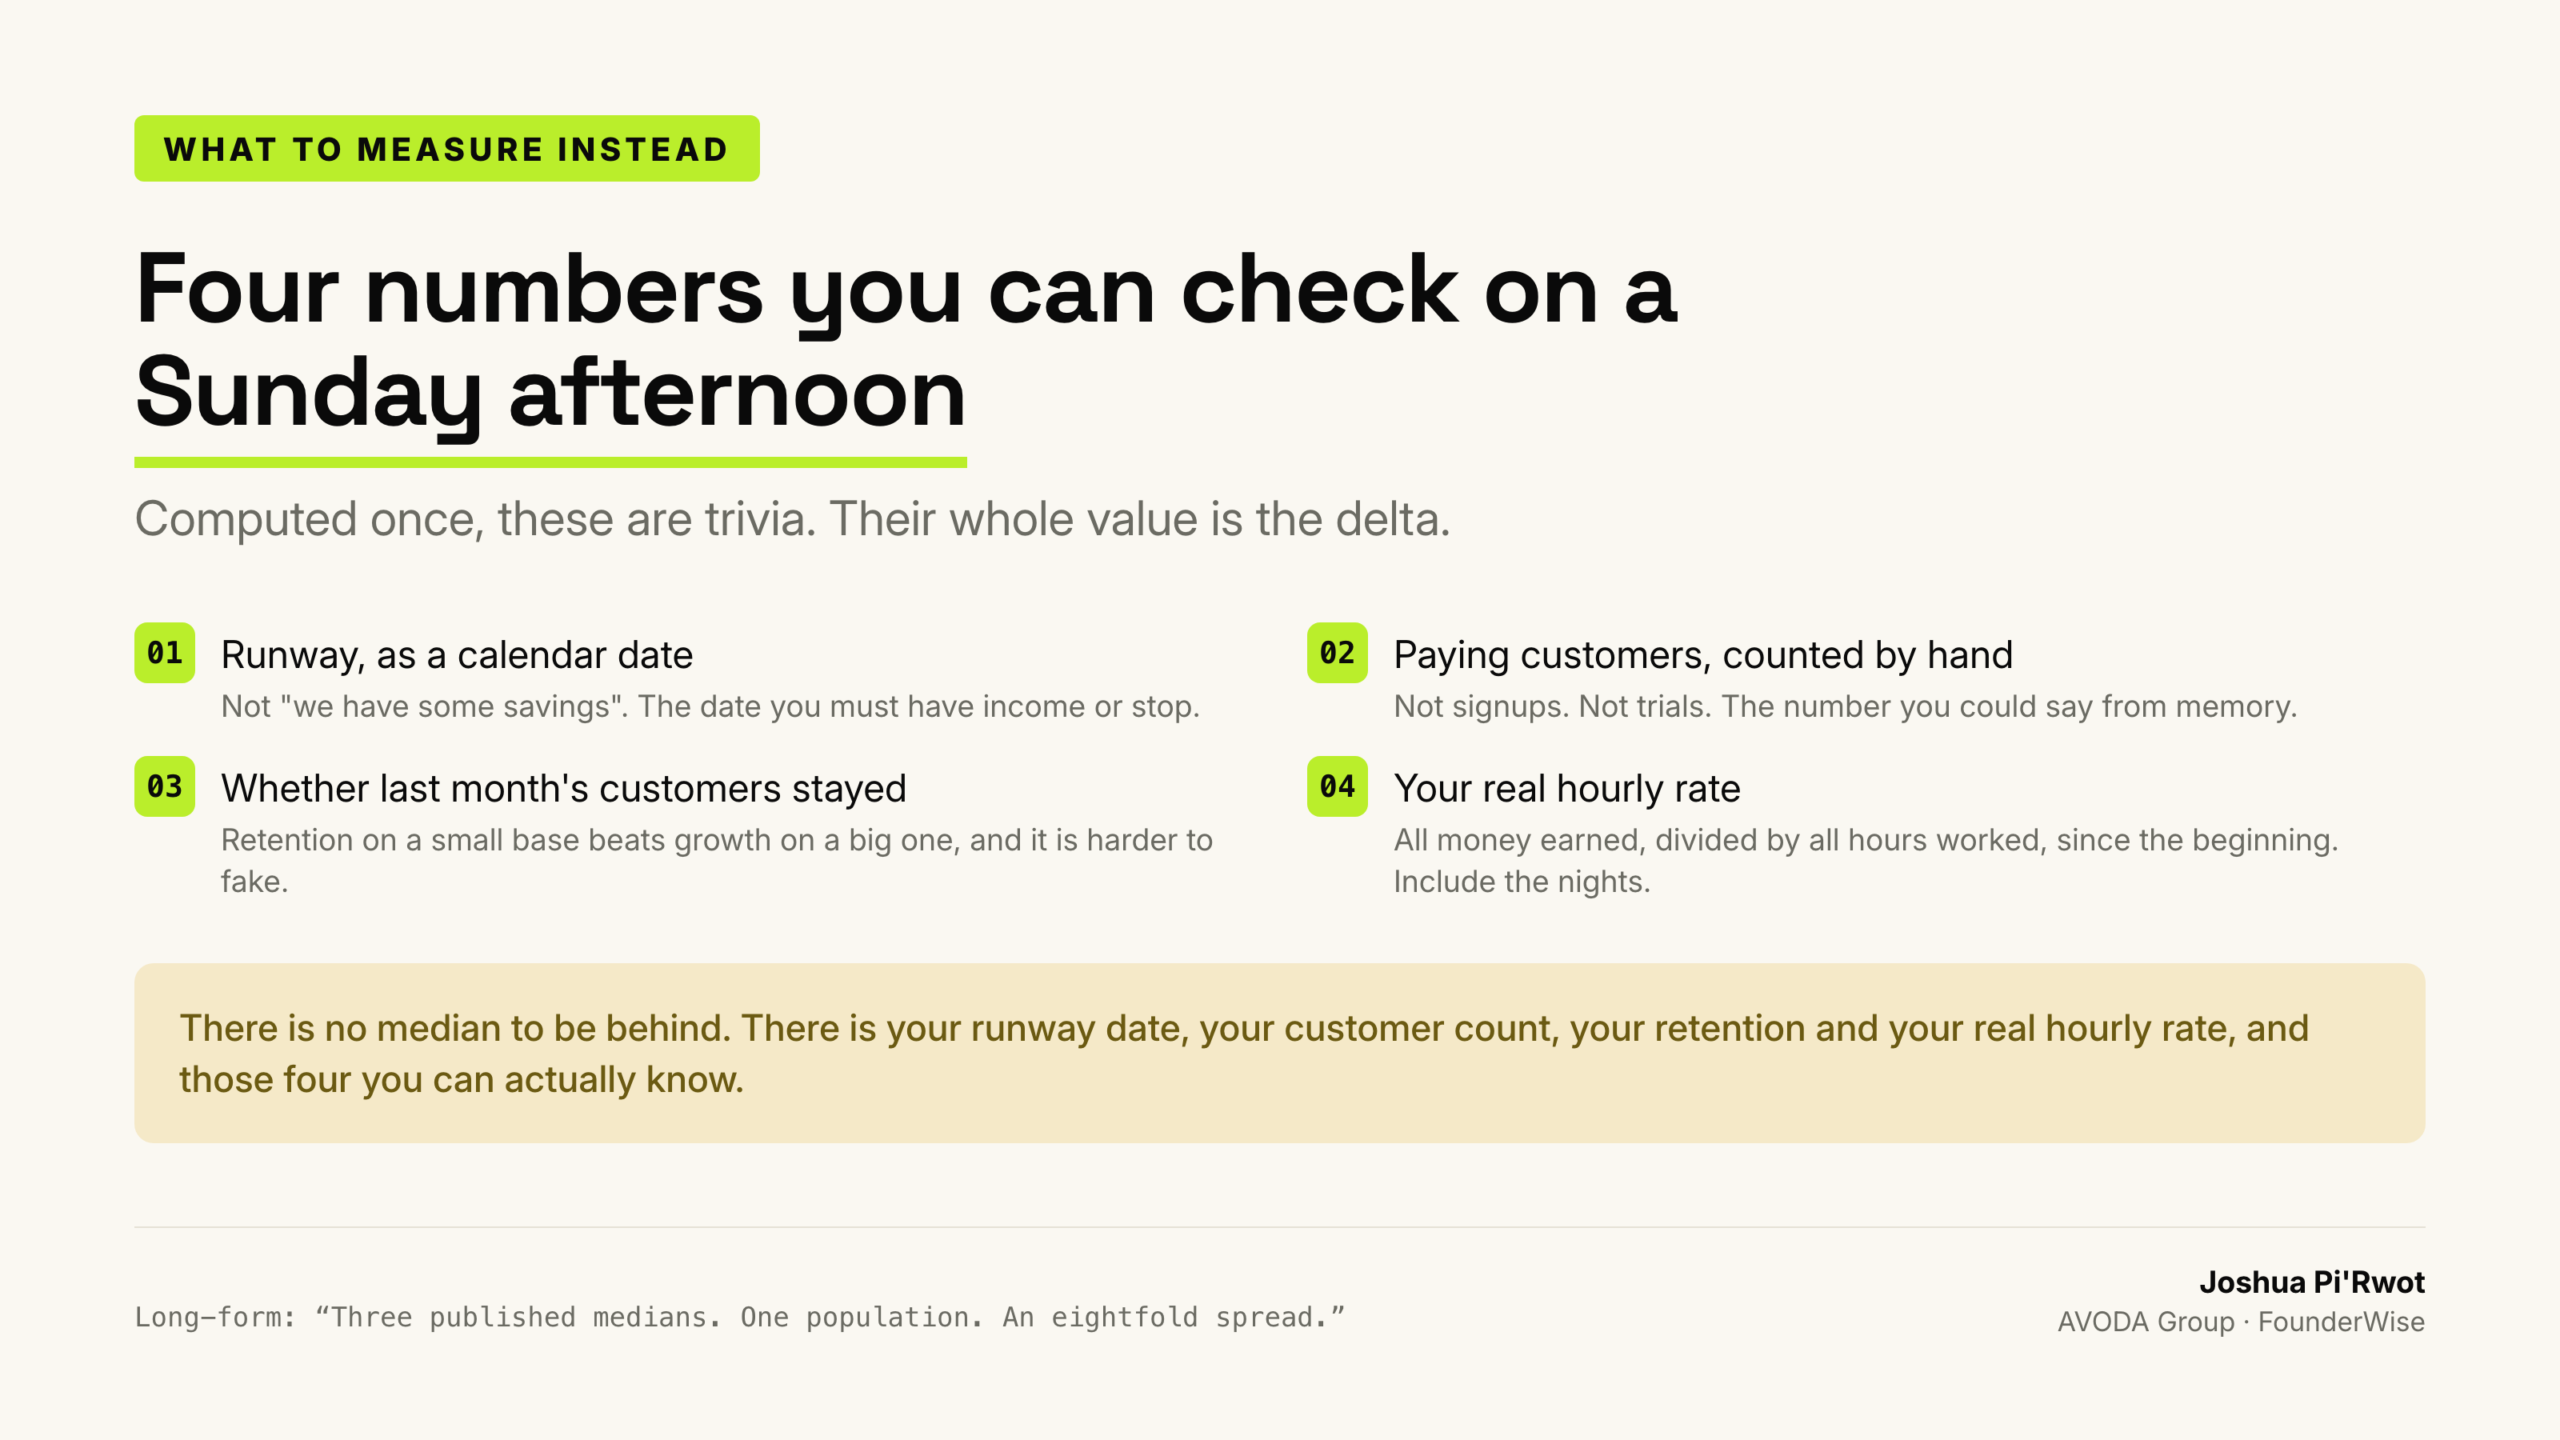
One condition attached, and it is the one people skip. Computed once, those four numbers are trivia. Their value is in the delta. What your runway date was in June against what it is now. Whether retention held while you were shipping. Whether the hourly rate is climbing or flat. A number you check once tells you where you are. The same number checked monthly tells you which direction you are moving, and direction is what carries information about next quarter.
So whatever you use, use something that keeps the history. A spreadsheet works. Recalculating from scratch each time you feel anxious is what most people do, and it costs you the one comparison worth having.
What This Looks Like From Kampala
There is a version of this that is specific to where I sit, and it cuts in an unexpected direction.
Every figure above is denominated in dollars and implicitly priced against a Western cost of living. Fifty thousand dollars a year is a modest outcome in San Francisco and a different proposition entirely in Kampala, Nairobi or Lagos. The same revenue, against a different cost base, is a different life.
So the optimistic-sounding numbers are, if anything, understated for a founder here, on the income side.
The distribution is harsher on the other side, though, and this is the part that gets left out. Distribution is the binding constraint in solo software. It is also where sitting outside the main market costs you most. Payment rails take longer to set up. Your home market is too small to be your first market. The audience game runs on platforms whose defaults were built for somewhere else.
The revenue that counts as success here is lower. The probability of reaching it is also lower. Both adjustments go unpublished, so people import the whole picture raw.
So the local founder gets both readings at their worst. Encouraged by a median computed over survivors in a richer market. Then judged against a growth rate that assumes access they were never given. If you are building from here, the four internal numbers at the end of this piece are the only instruments calibrated to your actual situation.
Yes, I Have Spent An Article Saying I Do Not Know
“You have just spent an article saying you do not know”
Fairly put. What I know is narrower than what the sector claims. It is still usable. The distribution is long-tailed. The published medians disagree by a factor of eight. The best survey is stale and says something the genre would rather skip. And your own numbers beat all of it.
I would rather hand you that than a confident figure I would have to abandon the moment you pushed.
“This applies to every industry, so it is not really about indie hackers”
Selection bias is general, true. But it bites hardest where exit is silent and entry is free, and solo software is close to the purest example of both. Starting is free and silent. Quitting is free and silent. That combination is what makes the measurement problem unusually severe here rather than merely present.
“The AI tooling wave changed all of this anyway”
Possibly, and this is the strongest objection. If one person can now build what took four, the historical distribution may genuinely be a poor guide. Two things though. The build was rarely the binding constraint, distribution was, and the tooling wave leaves distribution roughly where it found it. And the best survey predates the wave, so anyone claiming to know what it did to the numbers is reasoning from anecdote. Including me.
You Have Been Using Someone Else’s Instruments
There is a version of this article that reads as discouragement. The argument runs the other way.
You have been navigating with someone else’s instruments, calibrated for a population you are not in. Almost every number you have absorbed about what this life pays was computed over the people it worked for.
You are not behind the median. There is no median. There is your runway date, your customer count, your retention, and your real hourly rate, and those four you can actually know.
This article is for you if:
you have ever compared yourself to a published figure and felt behind.
It is not for you if:
you already track your runway date, your paying customers, your retention and your real hourly rate. You have better data than this article does.
The four numbers above are the ones I built FounderWise to hold. A short assessment gives you a score with the weakest category named, and then it keeps the history, so the next time you look you are comparing yourself to yourself in June rather than to a median somebody computed over survivors. Free to start, no card, one email link: https://app.founderwise.io
Advice is free. A year spent measuring against the wrong benchmark is not.
Josh
Know where you stand
Your runway date. Your paying customers. Whether last month’s customers stayed. Your real
hourly rate. Four numbers you can check on a Sunday afternoon, and the only four calibrated to
your actual situation.
Computed once they are trivia. Their value is in the delta, which means something has to keep
the history.
A short assessment gives you a score with the weakest category named, then
keeps the history, so next time you are comparing yourself to yourself rather than to a median
somebody computed over survivors.